SpendRule Raises $2M to Help Hospitals Track and Control Spending
Product
The CFO's Case for Prepayment Controls: Pricing Inaction
Written by

Joseph Akintolayo
Co-Founder
Date published
Reading time
Share blog
Every capital request I have seen gets evaluated against a cost of action. What does this initiative cost, and what is the return? None get evaluated with equal rigor against the cost of inaction, which is what it costs to keep doing exactly what you are doing today. For prepayment controls, the second number is usually the more persuasive one.
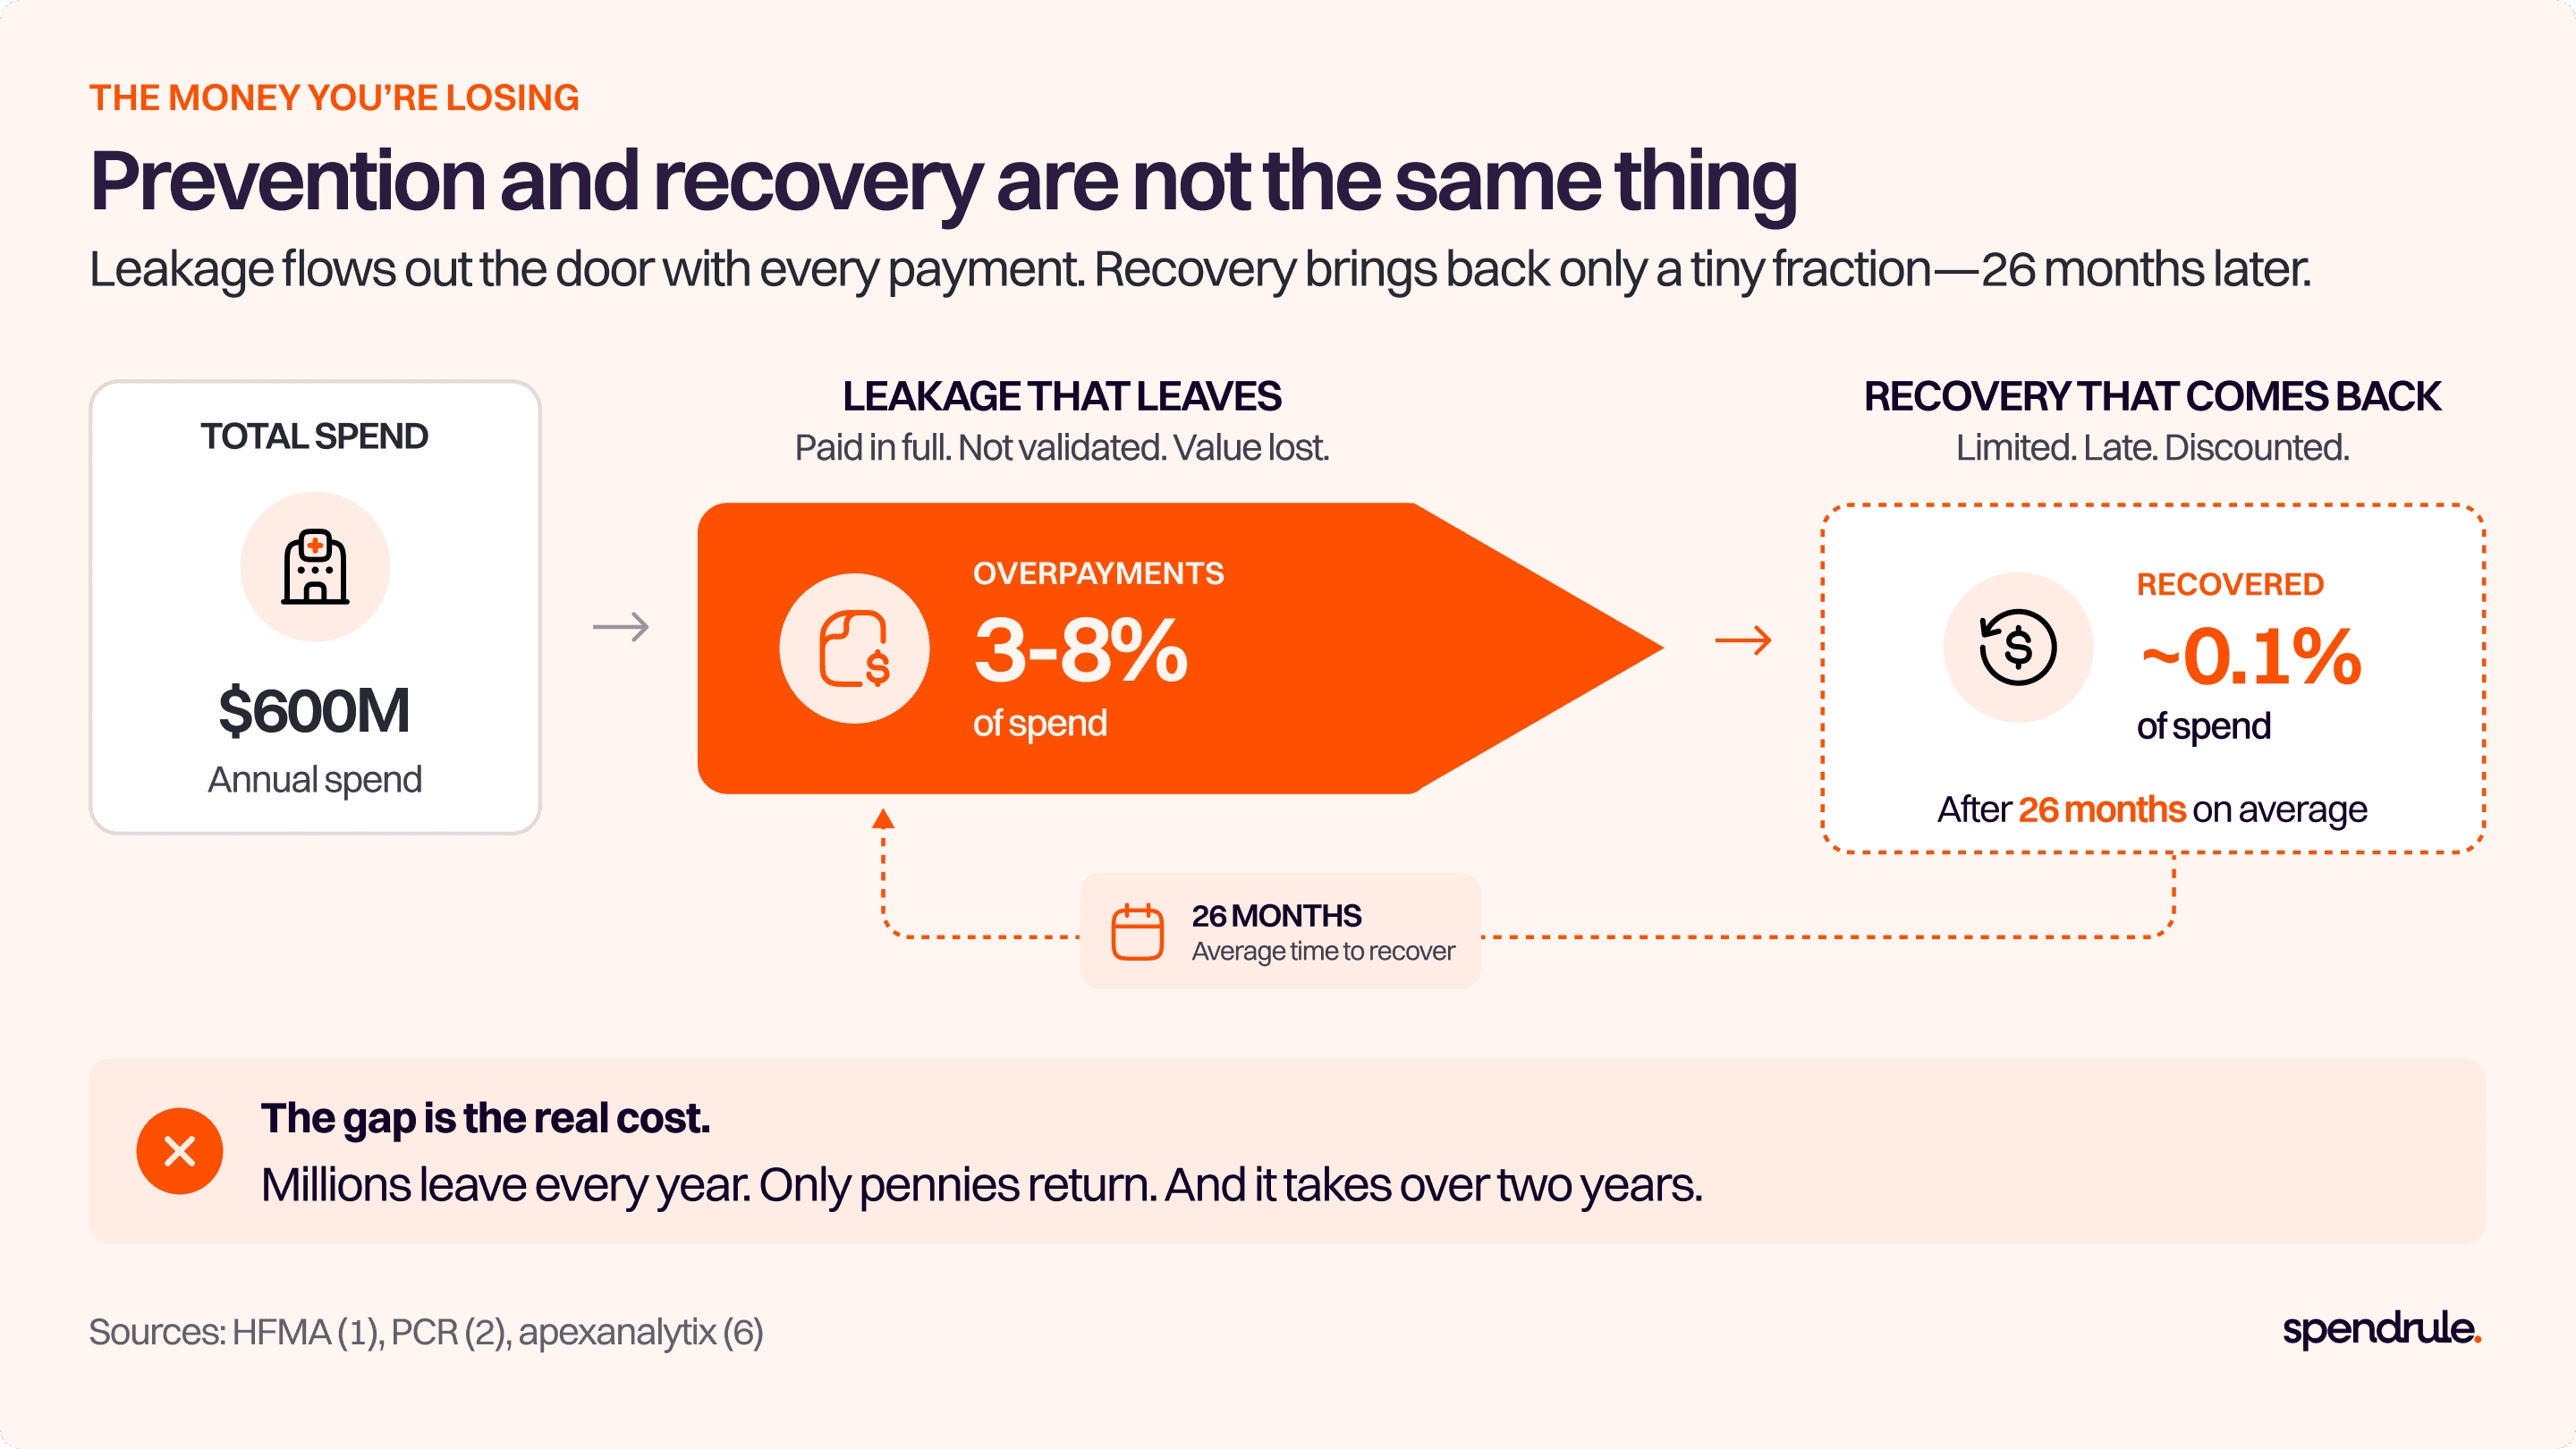
Purchased services can represent more than 50% of a hospital's nonlabor expenses, and hospitals commonly carry untapped opportunities to reduce that spend by 10% to 15%. Overpayment runs at 3-8%, and it takes an average of 26 months to get a small fraction of that money back. Manual accounts payable teams capture only 20% to 30% of available early-payment discounts. None of that shows up as a budget line. All of it is funded in full, every year.
This article lays out a four-part calculation a CFO can run before the next planning cycle, converts the result into board-ready margin language, and prices what prevention costs on the other side of the ledger.
The Line Item Nobody Wrote
Doing nothing is not a zero-cost option. It’s a decision to continue funding the current state, and the current state has a price. The reason it rarely gets debated is structural: the cost of inaction never arrives as an invoice with a signature block. It arrives distributed across thousands of individually unremarkable payments, each one plausible, each one approved, none of them large enough to trigger a second look.
That’s what makes it durable. A $250,000 capital request gets three levels of scrutiny. A $250,000 annual leakage rate spread across 40,000 invoices gets none, because no single transaction is big enough to be anyone's problem. Research from World Commerce & Contracting puts the cost of poor contract management at roughly 9% of the bottom line, and the mechanism is exactly this: value agreed at signature quietly fails to show up in execution.
The exercise below gives that cost a number. Run it with your own figures. The arithmetic is simple, and the inputs are already in your general ledger.
Component One: The Leakage You Are Funding Today
Start with purchased services, because it is the largest category with the weakest controls. HFMA reports that purchased services can reach far more than 30% of a hospital's nonlabor expenses and that hospitals typically have untapped opportunities to reduce that spend by 10% to 15%, a range it notes may be far higher than what remains available on supply spend, where the low-hanging fruit has usually been harvested.
On a $400 million purchased services budget, that is $12 million to $32 million of avoidable cost leakage that’s embedded in business as usual. Not a projected efficiency gain. Money leaving the organization every billing cycle because nothing is checking invoices against contract terms before payment is released.
If that range feels aggressive for your organization, the confidence data suggests otherwise. Analysis finds that only 15% of supply chain leaders say they are confident their purchased services costs are competitive. The other 85% are, by their own assessment, operating without the evidence to know.
Component Two: The Recovery Discount
The standard objection at this point is that leakage is already handled, because the organization runs a recovery audit. That instinct feels cost-neutral. It’s not, and the gap is bigger than most finance teams assume.
Industry analysis from apexanalytix puts typical accounts payable recovery audit returns at around 0.1% of total spend, with the audit firm keeping 20% to 30% of whatever it finds. Set that against an overpayment rate of 3% and the shortfall is visible immediately: on $600 million of spend, even a 3% overpayment rate is $18,000,000 lost. Recovery brings back a portion of that, months later, net of a contingency fee.
Then there is the timing. PCR reports that the average recovered overpayment is 26 months old by the time it is recovered. For a CFO, that is not a rounding detail. It means the dollar was out the door for more than two fiscal years, doing nothing, in an environment where the same dollar held internally funds working capital. Recovery is a real backstop and worth keeping. It’s not a control, and it shouldn’t be priced as one.
Component Three: Discounts That Were Already Yours
The third component is the cleanest to quantify because it requires no negotiation and no vendor dispute. The money is contractually available and simply never claimed.
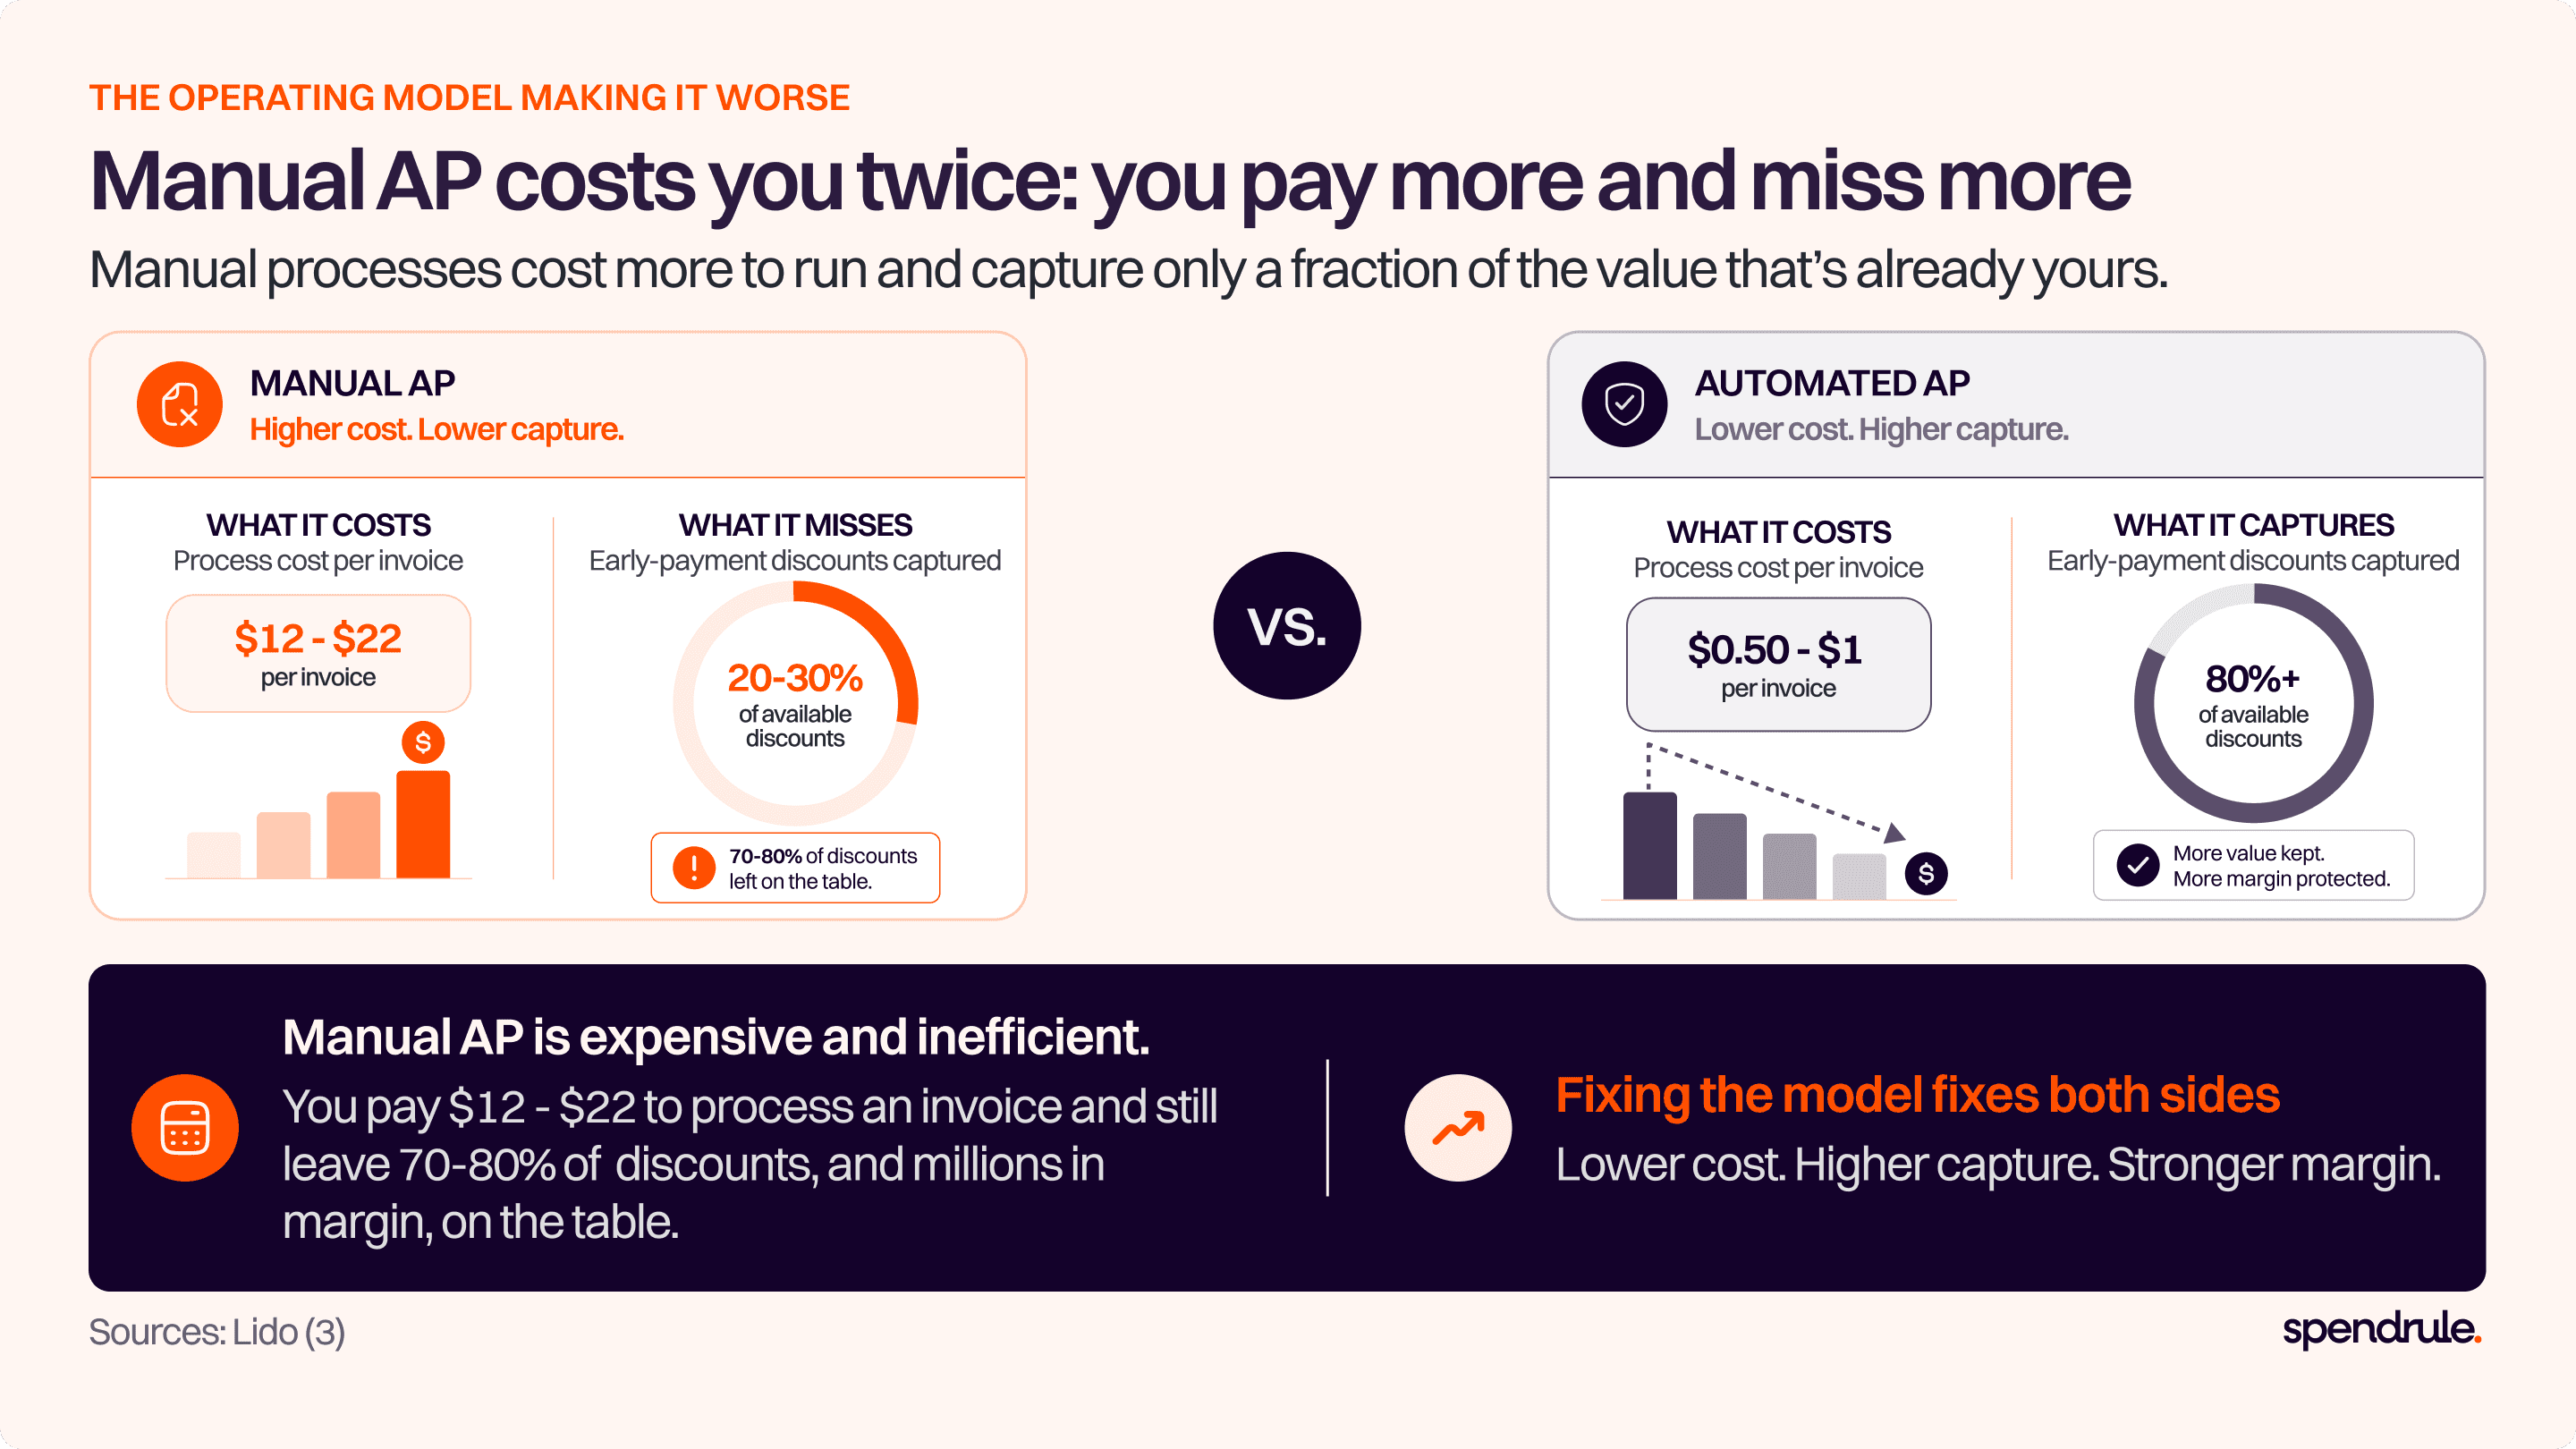
Benchmark data compiled by Lido shows that organizations running manual accounts payable workflows capture only 20% to 30% of available early-payment discounts, compared with above 80% for fast, automated processing. On $10 million in annual payables under standard 2/10 net 30 terms, that gap works out to $140,000 to $160,000 in missed discounts every year. Scale it to your own payables volume. The number moves linearly, and it recurs annually with no decay.
This is the component that tends to move a board, because it can’t be argued as a modeling assumption. The discount terms are in the contract. The capture rate is in the payment data. The difference is the loss.
Component Four: The Cost of Processing Itself
The honest version of this case has to address cost, not just savings, and this is where the argument usually gets made backwards. Prepayment controls are not a new cost layered on top of existing accounts payable operations. In well-designed implementations they reduce the cost of the operation while preventing the leakage that recovery audits exist to clean up afterward.
Manual invoice processing runs roughly $12 to $22 per invoice, with APQC benchmarks putting the overall median at $21.40 and top-quartile performers at $10.18. Semi-automated processing brings that to $3 to $5, and fully automated extraction runs $0.50 to $1.00. Across tens of thousands of annual invoices, that spread is a meaningful budget line on its own, before counting a dollar of prevented leakage.
Which means the cost-of-inaction calculation has a term most business cases omit entirely: the current state is not only leaking money on the contract side, it’s paying a premium to do so.
Translating the Number Into Board Language
A finance committee doesn’t need a fifth spend-management pitch. It needs the number in the currency it already uses, which is margin.
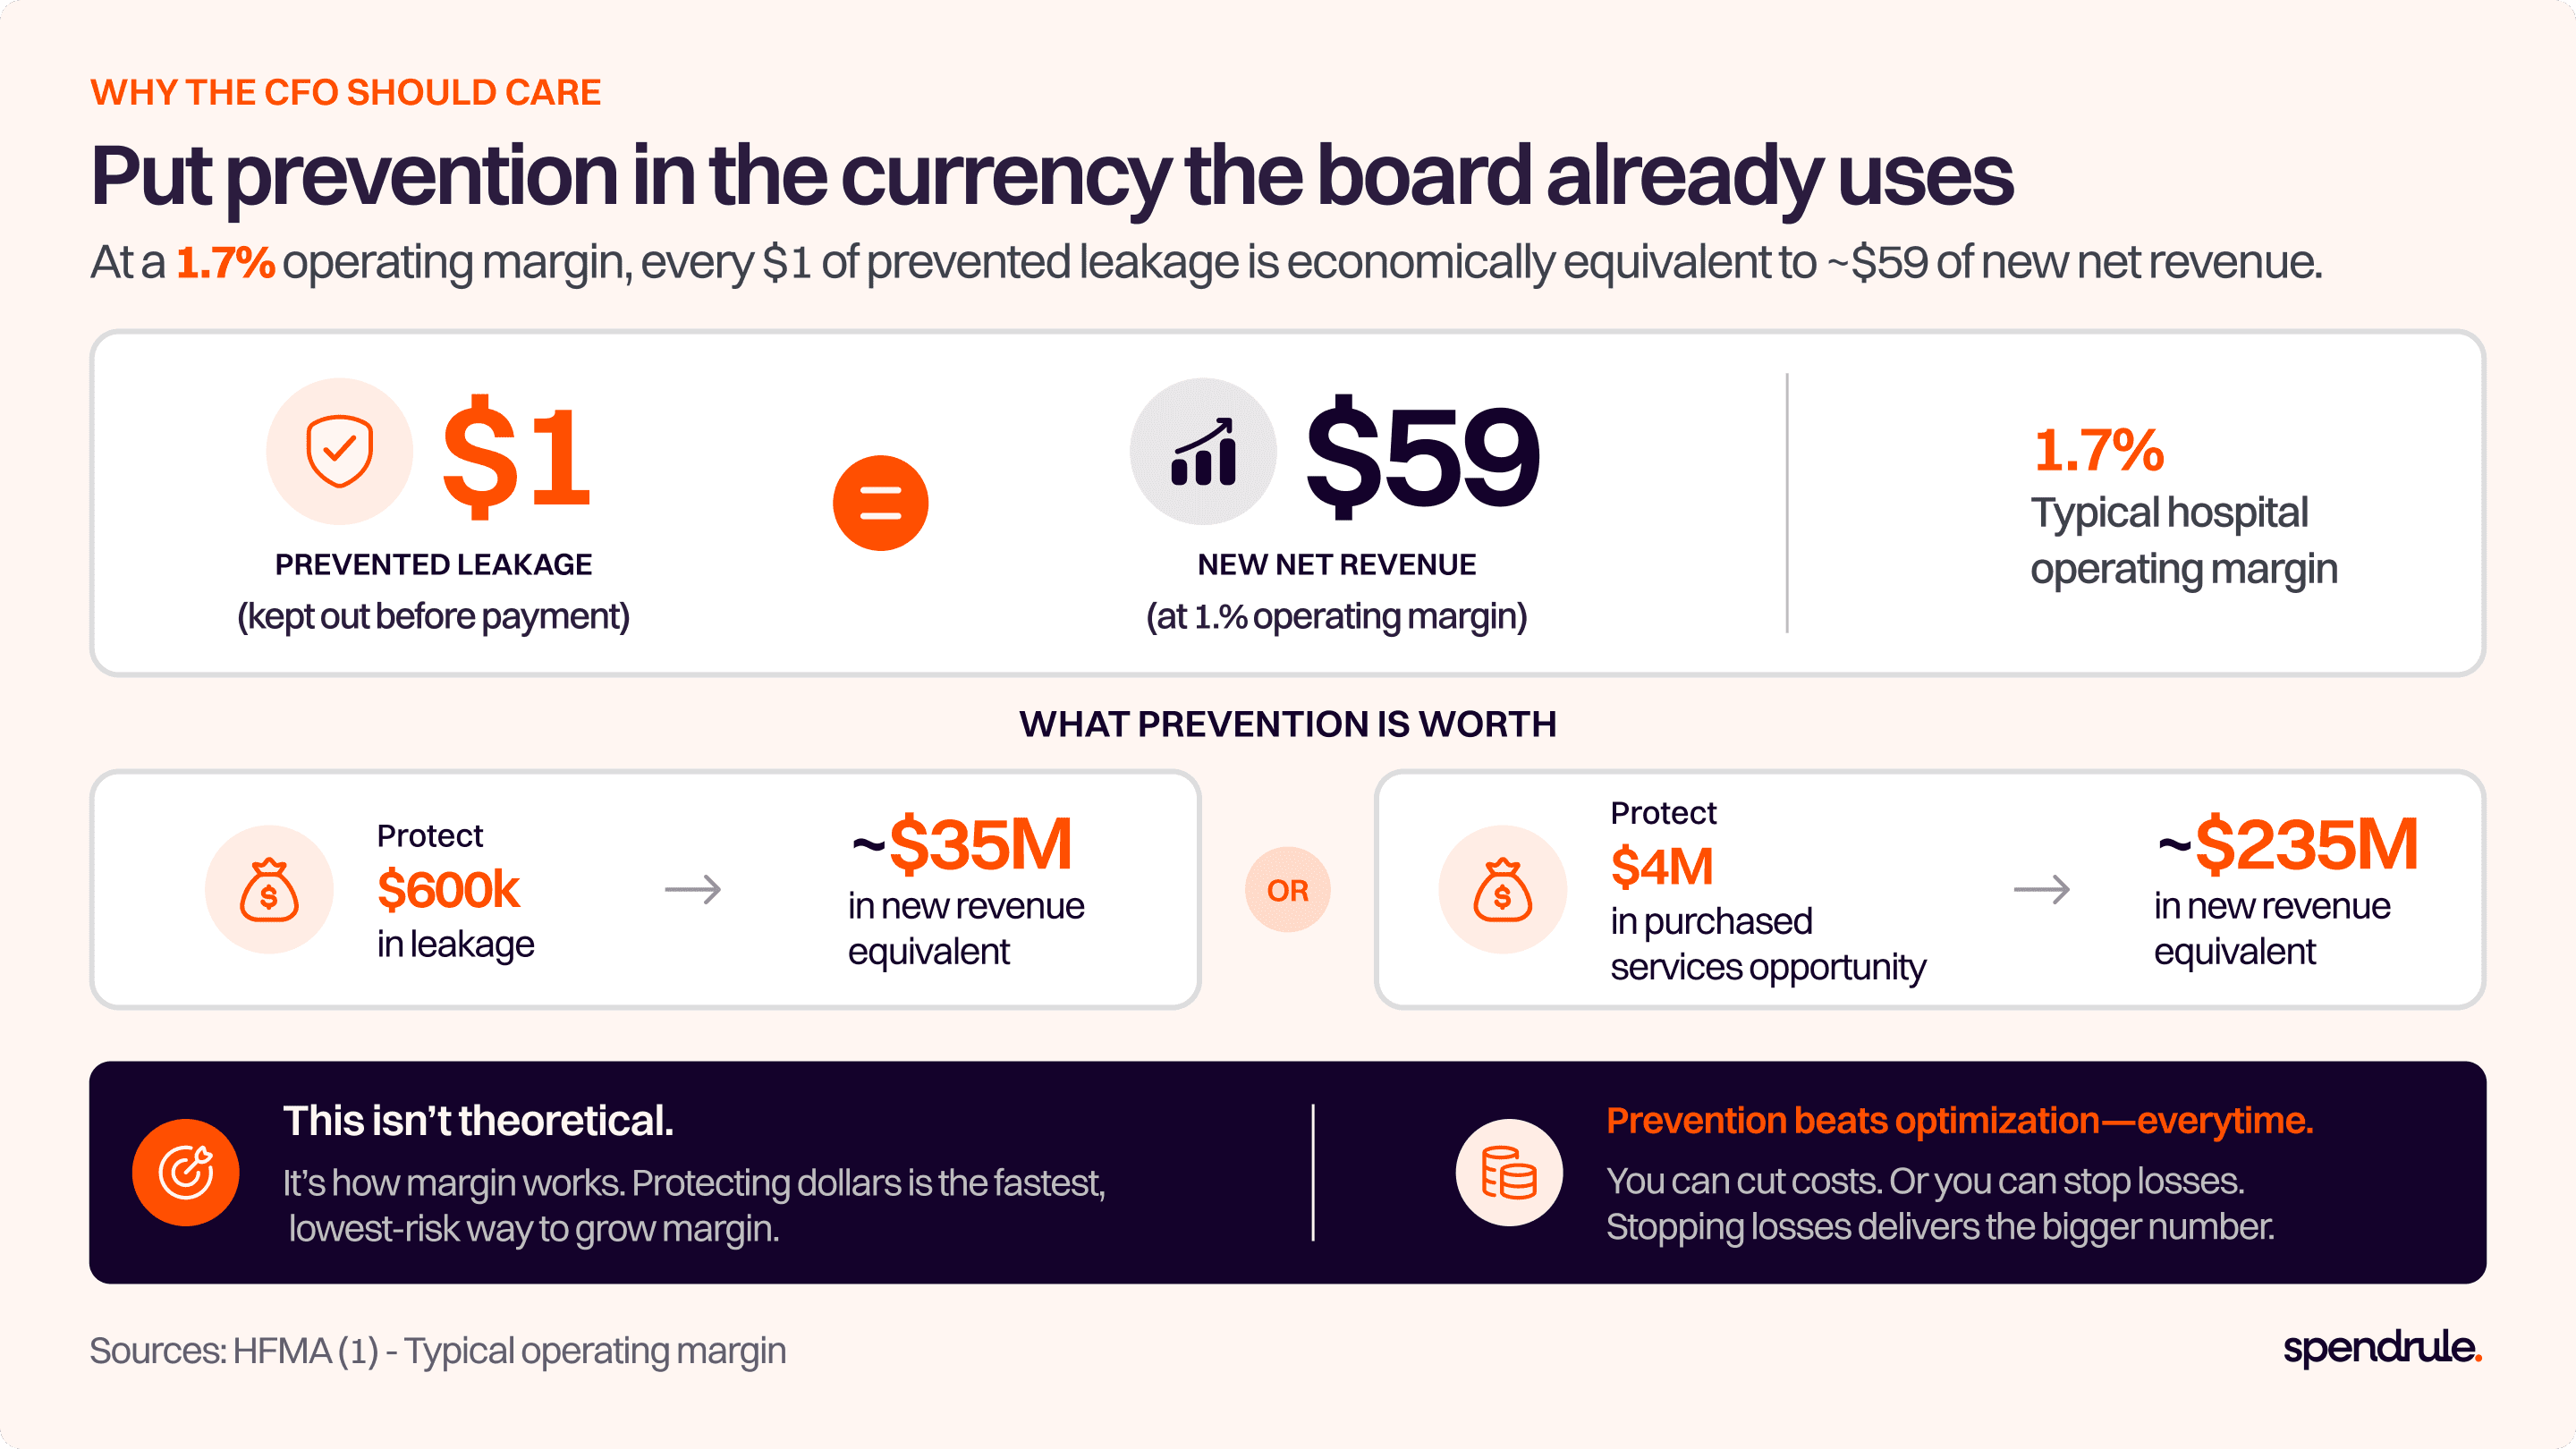
Kaufman Hall reports that the adjusted year-to-date operating margin for hospitals closed March 2026 at 1.7%. At that margin, every dollar of prevented leakage is economically equivalent to roughly $59 of new net revenue. A $600,000 leakage rate is the margin equivalent of about $35 million in additional revenue. A $4 million purchased services opportunity is the equivalent of roughly $235 million.
No growth initiative on your capital list will produce $235 million in new revenue this year. That is the entire argument, and it’s why prevention deserves to be evaluated against revenue initiatives rather than against other back-office software.
How to Run This Before the Next Cycle
The calculation takes an afternoon, not a project plan.
Pull total annual non-labor spend and isolate purchased services. Apply a conservative 10% opportunity rate rather than the 15% ceiling.
Pull the last three years of recovery audit findings. Divide gross recoveries by total spend, subtract contingency fees, and note the average age of each recovered item.
Pull payment terms across your top 50 vendors by dollar volume, identify which carry early-payment discounts, and calculate actual capture rate against available discount value.
Divide fully loaded accounts payable labor cost by annual invoice volume to get your true cost per invoice, then compare it to the benchmarks above.
Sum the four. Divide by your operating margin. That is the revenue-equivalent figure, and it belongs on the first slide.
Then ask the question that decides the matter: what percentage of your highest-dollar purchased services invoices are validated against contract terms before payment is released? If the answer is effectively zero, every number you just calculated is recurring, and it will recur again next year.
Where SpendRule Fits
We built SpendRule on the premise that the most expensive thing a finance organization can do is wait. Recovery audits, dashboards, and periodic spend reviews share a structural limitation: they report on money after it has left. Prepayment controls move the intervention point to before the payment clears, which is the only point in the cycle where the cost of doing nothing converts into savings that are never lost in the first place.
Practically, that means reconciling invoice line items against active contract terms inside the payment workflow, so a rate that has drifted from its negotiated tier surfaces on invoice one rather than invoice twelve, and so a discount that was contractually available is captured rather than reconstructed later from an aging report.
Conclusion
If your last capital planning cycle did not include a line quantifying what unmanaged purchased services and vendor billing leakage costs annually, that is the gap to close before the next one. The inputs are already in your systems. The arithmetic is a single afternoon of work. And the resulting number reframes prepayment controls from a discretionary technology purchase into what they actually are, which is a margin protection decision funded out of spend the organization is already committed to.
The number is rarely small. And unlike most line items competing for your budget, this one does not ask the organization to spend more. It asks the organization to stop paying for what it never agreed to.
See what prevention can protect for your organization.
Give SpendRule 10 contracts and 10 invoices. We will surface real savings opportunities in under 10 minutes.
Joseph Akintolayo
Co-Founder
Share blog